Two people can step on the same scale, see the exact same number, and be standing on completely different bodies. One carries 15% body fat. The other carries 35%. Same weight, same height even — but one has a visible waistline and steady energy levels, while the other is carrying a meaningfully higher risk of metabolic disease. The scale tells you how much you weigh. It says nothing about what you’re made of.
This guide covers both halves of that question. First, the healthy body fat ranges for men and women across different ages and activity levels, based on research from the American Council on Exercise (ACE), the American College of Sports Medicine (ACSM), and body composition researcher Timothy Lohman. We’ll also get into why men and women genuinely need different ranges — it’s physiology, not a double standard. Second, four ways to estimate your body fat at home, ranked by accuracy, including the one thing almost no other article explains clearly: which method to trust for an accurate snapshot versus which one to trust for tracking change over time. Once you know roughly where you sit, the next logical step is working out how many calories you actually need — our free TDEE calculator uses body fat percentage to fine-tune that number through the Katch-McArdle formula, which we’ll come back to later in this guide.
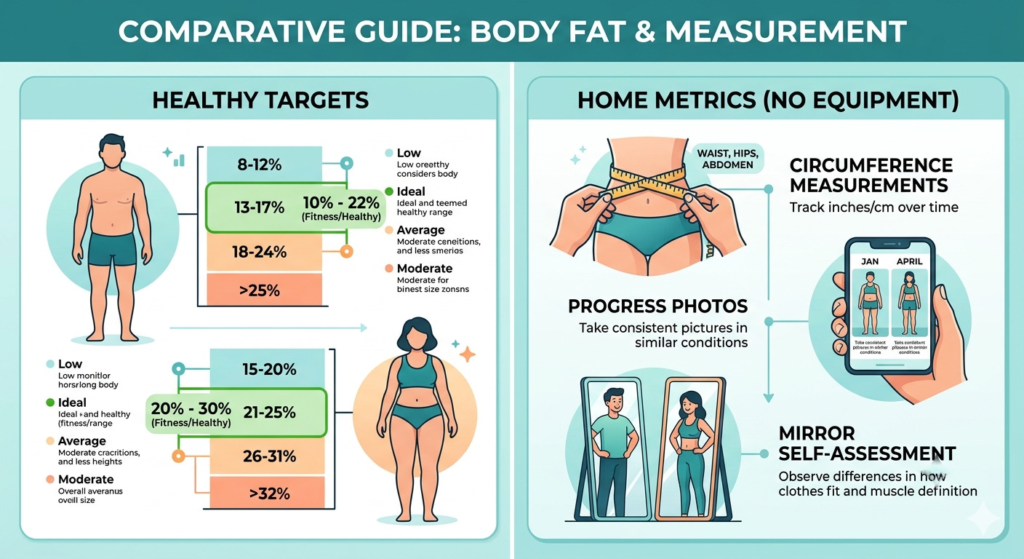
Why Men and Women Have Different Healthy Body Fat Ranges
If you’ve ever looked at a body fat chart and wondered why the “healthy” range for women sits 10 to 15 percentage points higher than for men, you’re not imagining it — and it’s not because women are held to a different fitness standard. It comes down to essential fat. Essential fat is the baseline amount of fat your body needs just to function — it’s woven into nerve tissue, bone marrow, organ linings, and cell membranes. For men, that’s roughly 2–5% of body weight. For women, it’s roughly 10–13%, according to research by Timothy Lohman (1993) and figures used by the American Council on Exercise. That gap alone — roughly 8 percentage points — explains most of the difference in healthy ranges between the sexes. Women carry this extra essential fat for hormonal regulation, reproductive capacity, breast tissue, and fat reserves around the hips and thighs that support pregnancy and lactation. On top of that, women generally carry less muscle mass relative to total body weight than men do, even at similar fitness levels — and since fat and muscle make up most of body weight between them, less muscle means a higher percentage is fat by default. None of this means women are “less fit” at a given body fat percentage than men. It means the two scales were never meant to be read against each other.Essential Fat — The Absolute Minimum Below Which Health Fails
Essential fat isn’t a fitness target or an aesthetic floor — it’s a survival threshold. Drop below it and the consequences aren’t cosmetic. For men, going under roughly 2–5% body fat starts to affect hormone production, immune function, and organ cushioning. For women, dropping below roughly 10–13% can disrupt hormone regulation, suppress immune function, and in many cases trigger hypothalamic amenorrhoea — the loss of a menstrual cycle due to insufficient body fat, which research shows often begins somewhere around 15–17% body fat in many women, well above the essential fat floor itself. This is the distinction that gets lost in most body fat content: there’s a difference between the essential fat floor (the line below which your body stops functioning properly) and the healthy range floor (the level that supports good health long-term). Competitive bodybuilders and physique athletes who diet down toward single digits (men) or the mid-teens (women) for a competition are operating in a zone meant for short-term performance or aesthetic goals — not a place to live year-round, and not somewhere to go without experienced coaching.Healthy Body Fat Percentage Ranges for Men — By Category and Age
The table below uses the widely cited ACE classification system, with an age adjustment that most charts skip entirely. Body fat naturally creeps upward with age even in people who maintain their training and diet — roughly 2–3% per decade — so a 50-year-old man sitting at 22% body fat is in a comparable position, health-wise, to a 30-year-old man at around 18–19%. If you’re over 40 and comparing yourself to a chart built for 25-year-olds, you’re measuring yourself against the wrong yardstick.| Category | Ages 20–39 | Ages 40–59 | Ages 60+ |
|---|---|---|---|
| Essential | 2–5% | 2–5% | 2–5% |
| Athletic | 6–13% | 8–15% | 10–16% |
| Fit / Healthy | 14–17% | 17–20% | 18–21% |
| Acceptable | 18–24% | 20–26% | 22–28% |
| Obese | 25%+ | 27%+ | 29%+ |
What Different Body Fat Percentages Actually Look Like on Men
Numbers on a chart don’t mean much until you connect them to what you’d actually see in a mirror. Here’s the practical breakdown, based on visual reference data widely used by body composition labs like BodySpec and InBody. 6–9%: a full six-pack with visible separation between each segment, visible striations running through the muscles, and prominent vascularity across the arms and shoulders. This is competition-level leanness — sustainable for weeks, not years. 10–13%: a clearly visible four-to-six pack under good lighting, with clean muscle separation across the torso. Still lean enough that most people would describe this as “shredded,” but more sustainable than the range above. 14–17%: a flat stomach with the upper abs visible when flexed or under good lighting, and a visibly athletic shape through the shoulders and chest. This is the range most people picture when they imagine being “in shape.” 18–22%: a healthy, normal appearance — some softness across the midsection, no visible ab definition, but no excess fat carried around the waist either. This is a completely normal, healthy body composition for an active adult. 25% and above: noticeable fat accumulation around the abdomen, a fuller or rounder facial appearance, and — statistically — a higher likelihood of elevated markers like blood pressure, fasting glucose, and cholesterol.Healthy Body Fat Percentage Ranges for Women — By Category and Age
The same age-adjustment logic applies here. A 50-year-old woman at 29% body fat is in roughly the same health position as a 30-year-old woman at 25–26% — the shift reflects normal hormonal changes around midlife, not a decline in health.| Category | Ages 20–39 | Ages 40–59 | Ages 60+ |
|---|---|---|---|
| Essential | 10–13% | 10–13% | 10–13% |
| Athletic | 14–20% | 16–22% | 18–24% |
| Fit / Healthy | 21–24% | 23–26% | 25–28% |
| Acceptable | 25–31% | 27–33% | 29–35% |
| Obese | 32%+ | 34%+ | 36%+ |
What Different Body Fat Percentages Actually Look Like on Women
14–19%: a competitive, athletic build with visible muscle definition throughout the body and very little visible fat anywhere — the kind of physique associated with elite-level training volume and, often, professional supervision. 20–24%: a fit, athletic appearance with clear definition in the shoulders and arms and a flat or near-flat abdomen. This is the range most people would describe, simply, as “very fit.” 25–29%: a healthy appearance with some natural softness, without looking overweight — clothes fit well, and there’s no health concern at this level. 30–35%: a noticeably softer or rounder figure, with some fat accumulation around the midsection and clothes fitting more tightly. At the upper end of this range, markers like blood pressure and cholesterol may start trending upward. Above 35%: significant fat accumulation with a meaningfully elevated health risk — markers associated with metabolic syndrome become much more likely at this level.How to Measure Body Fat at Home — Four Methods Ranked by Accuracy
Before getting into the methods themselves, it helps to be clear about what you’re actually trying to find out — because different tools answer different questions. If you want one accurate number right now, a DEXA scan is the answer. If you want to track real change over weeks and months, skinfold callipers or the US Navy method, used consistently, will serve you better. If you want a quick daily-ish read just to stay aware, a BIA scale works — as long as you understand its limits. Most confusion about body fat measurement comes from using the wrong tool for the question you’re actually asking.Method 1 — DEXA Scan (Gold Standard, ±1–2% Accuracy)
Dual-energy X-ray absorptiometry (DEXA) is the clinical reference standard for body composition — accurate to within roughly 1–2% when compared against direct cadaver analysis. A DEXA scan doesn’t just give you a single body fat percentage; it breaks down fat mass, lean mass, and bone density separately, and shows you exactly where fat is distributed across your arms, legs, and trunk. You’ll need access to a private imaging clinic, a sports science department, or a body composition service — typically costing somewhere around £100–200 in the UK or $150–300 in the US. The radiation dose involved is extremely small, roughly equivalent to a few hours of everyday background radiation exposure. The best use case for DEXA is as an occasional baseline — once or twice a year — rather than something you do every month. It tells you exactly where you stand; it’s just not designed for frequent repeat use.Method 2 — Skinfold Callipers (Jackson-Pollock Protocol, ±3–4% Accuracy With Correct Technique)
Skinfold callipers measure the thickness of skin and the fat layer beneath it at specific points on the body, then plug those numbers into a validated formula. The Jackson-Pollock 3-site protocol is the most accessible and widely used version. For men, the three sites are the chest (a diagonal fold halfway between the armpit and the nipple), the abdomen (a vertical fold about 2 cm to the right of the navel), and the front of the thigh. For women, the three sites are the back of the upper arm (triceps), a diagonal fold just above the hip bone (suprailiac), and the front of the thigh. The technique matters: pinch the skin firmly between thumb and forefinger, lift it away from the muscle underneath, place the calliper jaws about 1 cm from your fingers, and read the measurement after exactly two seconds. Take each site twice and average the readings. A more detailed 7-site version adds four more locations and gets closer to DEXA-level accuracy (around ±2–3%), but it really needs a second person trained in the technique to be reliable. A basic plastic calliper costs somewhere between £5 and £15. The biggest source of error isn’t the tool — it’s technique consistency. If you measure yourself, always use the same side of your body (right side is standard), the same time of day, before eating, and before training. Done this way, even if your absolute number is off by a couple of percentage points, the trend over time will be genuinely useful.Method 3 — US Navy Circumference Method (±3.5% Accuracy, Zero Equipment Cost)
If you don’t want to spend anything, the US Navy method — developed by Hodgdon and Beckett in 1984 — needs nothing more than a flexible tape measure and your height. It estimates body fat from a small set of circumference measurements, and in the original validation research it correlated at r=0.90 with underwater (hydrostatic) weighing, which is a strong result for a method that requires no equipment at all. For men: measure your neck at its narrowest point, just below the larynx, and your waist at the level of your navel. For women: measure your neck, your waist at its narrowest point, and your hips at their widest point. The formula then runs these measurements through a set of logarithmic calculations to estimate body fat percentage. It does have known weak spots. It tends to underestimate body fat in very lean people — below roughly 10% for men or 15% for women — because neck circumference doesn’t keep shrinking proportionally once you’re already lean. It can also overestimate for people who carry a lot of muscle around the midsection, since their waist measurement runs high relative to their actual fat levels. For most people without callipers, though, this is a genuinely solid, repeatable, zero-cost option — measure monthly and watch the trend.Method 4 — Bioelectrical Impedance Analysis (BIA) Smart Scales (±3–8% Accuracy, Highly Variable)
BIA scales and handheld devices send a tiny, harmless electrical current through your body and estimate body fat from how much resistance that current meets — fat resists the current more than muscle does, since muscle is roughly 73% water. Against DEXA, the published error margin for BIA sits around 3–5 percentage points under controlled conditions, but real-world readings swing more than that because BIA is extremely sensitive to hydration, recent food and drink, skin temperature, and the algorithm built into each specific device. Here’s a scenario that plays out constantly: the same person measures 18% body fat at 7am, fasted, before drinking anything — and 22% at 9pm after a meal and a couple of glasses of water. Nothing about their actual body composition changed in those twelve hours. The reading did, because hydration did. The fix is simple — treat BIA as a trend tool, not a measurement tool. Use the same device, at the same time of day (ideally first thing in the morning, after using the bathroom, before eating or drinking anything), weekly or every couple of weeks. Reputable brands like Withings, Tanita, and InBody tend to be more consistent than budget scales, but none of them match callipers or DEXA for absolute accuracy. The direction of the trend over a month is what matters — not any single number on any single day.The Most Important Rule in Body Fat Measurement — Consistency Over Accuracy
If there’s one thing worth taking away from this entire article, it’s this: for tracking progress, how consistently you measure matters more than how accurately you measure. Someone who uses callipers every month, on the same sites, at the same time of day, with the same technique, will end up with a clear and trustworthy trend — even if their absolute number sits 2–3% away from their “true” body fat percentage. Compare that to someone who measures with a BIA scale one week, callipers the next, occasionally gets a DEXA scan, and measures at random times of day. That person has a pile of numbers and no usable trend — because the noise between methods is bigger than the actual change in their body over that time. So here’s the practical version: pick one method and stick with it for tracking. Always measure under the same conditions. If you want an accurate absolute number — for a health conversation, or to set a real baseline — get a DEXA scan. For ongoing tracking, use the Navy method or callipers. For a rough daily sense of where you stand, a BIA scale is fine, as long as you’re reading the trend and not the daily number. These are three different jobs, and trying to make one tool do all three is where most people’s frustration with “inconsistent readings” actually comes from.When to Get a DEXA Scan and When You Do Not Need One
A DEXA scan is worth getting if you’re establishing a real baseline before making a major decision about your training or nutrition, if you have a clinical reason to know your body composition precisely — managing age-related muscle loss, meeting requirements for an athletic contract, or recovering from a history of disordered eating — or if your at-home readings (BIA versus Navy method, for example) keep disagreeing by more than about 5 percentage points, which suggests something’s off with how you’re measuring. For most people simply trying to lose fat or build muscle, though, a DEXA scan isn’t necessary. Monthly measurements with callipers or the Navy method, done consistently, are entirely sufficient to catch real changes. And it helps to know what “real change” looks like: a genuine, meaningful shift in body fat percentage is typically around 1–2 percentage points over 6–8 weeks. If your monthly measurement only moved by 0.5%, that’s not nothing — it’s roughly on track, and panicking about it (or celebrating prematurely) misreads the timescale these changes actually happen on.How Body Fat Percentage Connects to TDEE and Your Calorie Goals
Knowing your body fat percentage isn’t just an interesting number — it directly changes how accurately you can plan your nutrition, in three specific ways. First, it unlocks a more accurate calorie formula. The standard Mifflin-St Jeor equation works from total body weight, which doesn’t separate muscle from fat. The Katch-McArdle formula instead calculates your BMR from lean body mass — your weight minus your fat mass — which produces a noticeably more accurate TDEE for anyone who’s reasonably lean or muscular. You can see exactly how the two formulas compare, and when each one makes sense, in our Mifflin-St Jeor vs Harris-Benedict vs Katch-McArdle breakdown, and run the numbers yourself using the TDEE calculator. Second, body fat percentage is how you actually track body recomposition — losing fat and building muscle at the same time, which often shows almost no movement on the bathroom scale despite real, visible change. If the scale isn’t moving but your waist measurement and body fat percentage are trending down, that’s not a plateau — that’s recomposition working. Our body recomposition guide walks through exactly how to set this up. Third, your current body fat percentage is one of the clearest signals for whether you should be cutting, bulking, or recomposing right now. As a general guide, if you’re above roughly 20% body fat (men) or 28% (women), cutting first tends to make more sense than bulking — and vice versa below those thresholds. Our cut or bulk first guide goes into the reasoning behind these thresholds in more detail.Frequently Asked Questions
What is a healthy body fat percentage for a woman?
For women aged 20–39, the ACE-based ranges are: athletic 14–20%, fit/healthy 21–24%, acceptable 25–31%, with anything above 32% classified as obese. For women aged 40–59, the acceptable range extends to roughly 33%, reflecting normal hormonal changes around midlife. For women over 60, up to around 35% can be acceptable, since some additional fat reserve helps protect against bone density loss. Across all ages, the essential fat minimum for women is 10–13% — going below this affects hormonal function, bone density, and reproductive health.What is a healthy body fat percentage for a man?
For men aged 20–39, the ACE-based ranges are: athletic 6–13%, fit/healthy 14–17%, acceptable 18–24%, with anything above 25% classified as obese. For men aged 40–59, the acceptable range extends to roughly 26%, and the fit/healthy range shifts slightly to around 17–20%. For men over 60, up to around 28% can be acceptable. The essential fat minimum for men is 2–5% — below this, organ function and hormone production start to suffer. Men sitting at 6–9% body fat (visible six-pack, prominent vascularity) are in a range that’s only sustainable with serious training discipline — not a realistic target for most people year-round.Is 20% body fat healthy for a man?
Yes. For a man, 20% sits right at the boundary between the “fit/healthy” and “acceptable” ranges. Health markers like blood pressure and cholesterol are typically good at this level, and cardiovascular risk is low. Visually, a man at 20% will usually have a slightly soft waistline with no visible abdominal definition — which is completely normal. Getting down to 14–17% through consistent training and a moderate calorie deficit will bring out visible muscle definition, but 20% itself is a healthy, sustainable place to be.Is 25% body fat healthy for a woman?
Yes. For a woman, 25% sits comfortably within the “acceptable” range, at its lower end. A woman at this level will typically have a healthy appearance with a soft but not rounded midsection, and her health markers should fall within normal clinical ranges. This is a completely normal body composition for an active woman who isn’t specifically training for an athletic physique. The point where concern increases is above 32%, where the data on elevated disease markers becomes statistically significant.Can you reduce body fat without losing muscle?
Yes — with three things in place. A moderate calorie deficit, around 400–500 calories below your TDEE rather than 800 or more, gives your body room to lose fat without forcing it to break down muscle for energy. A high protein intake — roughly 2.0–2.4g per kg of body weight — supports muscle protein synthesis even while you’re eating less overall. And resistance training during the deficit gives your body a reason to hold onto muscle: it signals that the tissue is still being used and needs to stay. Without the training component, even a high-protein diet won’t fully protect lean mass during a deficit. Together, these three factors are what consistently produce fat loss without meaningful muscle loss in research settings.How often should I measure my body fat percentage?
Once a month is the right interval for most people — less often than you’d weigh yourself. Body fat changes slowly; a meaningful 1–2 percentage point shift takes around 6–8 weeks of consistent effort, so measuring more frequently than monthly mostly captures noise rather than real progress. Weekly measurements tend to create unnecessary anxiety from day-to-day hydration swings rather than useful feedback. If you can get an annual DEXA scan, that gives you an accurate baseline to interpret your monthly trend measurements against.Why does my BIA scale give different readings every day?
Because BIA scales measure electrical resistance through your body, which is driven mainly by water content — not fat mass directly. Your actual body composition doesn’t change much from one day to the next, but your hydration does, constantly. Drinking an extra 500ml of water before stepping on the scale can lower your reading by 1–3 percentage points. A large meal beforehand can push it up. Even a hard training session can temporarily shift the number, since water moves into your muscle cells afterwards. The fix is to measure under identical conditions every time — first thing in the morning, after using the bathroom, before eating or drinking anything. Doing this consistently removes most of the day-to-day swing and makes your weekly or monthly trend genuinely meaningful.Once you’ve got a body fat percentage you trust — even a rough one from the Navy method or callipers — it’s worth plugging it into the Katch-McArdle formula on the TDEE calculator to see how it changes your daily calorie target. And if you’re not sure whether your current numbers mean you should be cutting or building muscle first, our guide on whether to cut or bulk first walks through how to decide. For further reading on the research referenced in this article, the American Council on Exercise’s body fat percentage classifications are summarised by ACE Fitness, the original US Navy circumference method research is discussed in detail via Calculator.net’s body fat calculator reference, and a visual breakdown of body fat ranges by age is available from BodySpec.